
Bitcoin is moving higher again as geopolitical fears begin to fade.
The world’s largest cryptocurrency climbed back toward the $70,000 mark after tensions between the United States and Iran started to cool. Global markets responded quickly to the calmer tone in the Middle East. Risk appetite began to return across financial markets, and Bitcoin followed.
The rebound has revived debate about where Bitcoin could move next.
Crypto analyst Crypto Patel recently shared a detailed chart analysis outlining two possible scenarios for the coming weeks. His outlook highlights several key resistance zones that could determine whether the rally continues or stalls.
Geopolitics And Risk Sentiment Move Bitcoin
Bitcoin spent weeks under pressure as geopolitical uncertainty spread through global markets.
Risk assets such as cryptocurrencies often react sharply during periods of geopolitical stress. Earlier in the year, BTC saw a steep decline as investors shifted toward traditional safe-haven assets such as gold and U.S. Treasuries.
Recent developments changed the mood.
As concerns surrounding the US-Iran situation began to ease, Bitcoin climbed back toward the $70,000 level. The move is significant because that area has historically acted as a psychological pivot for the market.
According to Crypto Patel, reclaiming that level suggests buyers remain active despite earlier volatility. His chart shows Bitcoin now moving toward a key resistance zone sitting above current prices.
That zone could become the next battleground for the market.
Two Resistance Zones Could Shape Bitcoin’s Next Move
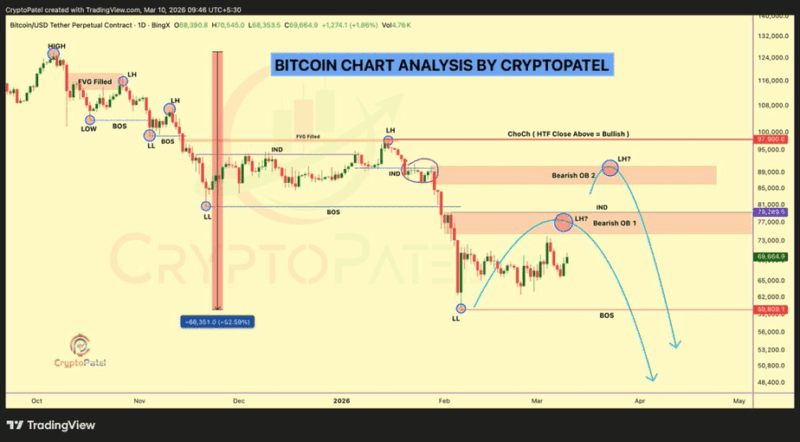
The chart shared by Crypto Patel outlines two areas where Bitcoin could face heavy selling pressure if the recovery continues.
The first resistance zone sits between $75,000 and $79,000. The analyst labels this region Bearish Order Block 1.
Order blocks are areas where large sell orders previously entered the market. When price returns to those levels, selling pressure often reappears as traders attempt to exit positions or defend earlier trades.
Bitcoin would need strong buying momentum to break through this barrier. A rejection in that range could push BTC back toward lower support levels.
The second resistance zone sits higher between $86,000 and $90,000. Crypto Patel identifies this area as Bearish Order Block 2.
If Bitcoin reaches that level, it would represent the final major resistance before the market can attempt a move toward six-figure territory.
Bitcoin Still Recovering From Earlier Correction
The chart also reflects the broader structure of Bitcoin’s recent market cycle.
Earlier in the year, Bitcoin reached a peak near $97,000 before entering a sharp correction that sent the price down by more than 50 percent. Such large drawdowns are not unusual in crypto markets, where volatility often exceeds that seen in traditional asset classes.
Recent price action shows Bitcoin forming a local bottom near $59,000. From that level, the market staged a strong rebound and resumed its climb.
That recovery leaves Bitcoin trading between a key support level and two major resistance zones.
$60,000 Support Is The Line Bulls Must Defend
Crypto Patel also highlighted a critical support level that could determine whether the bullish structure remains intact.
The $60,000 region sits just above the most recent market low. If Bitcoin falls below that level, the recovery pattern could weaken and open the door to deeper downside pressure.
For now, traders are watching how price behaves near the first resistance zone.
One scenario shows Bitcoin testing the $75,000 to $79,000 range. If buyers remain strong, BTC could push higher toward the $86,000 to $90,000 zone.
Another scenario involves a rejection near resistance. That could send Bitcoin back toward the $60,000 support area before the market attempts another rally.
Both paths leave Bitcoin at a pivotal moment as investors balance improving geopolitical sentiment with technical resistance levels that could shape the next phase of the crypto market.